Why we moved the agent out of the sandbox

We rebuilt Anything API to make conversations easier to resume, streaming easier to debug, and new models easier to support. In our benchmark, v2 cut median workspace recovery time by 45% compared with v1.
When a user sends a message and the agent appears to stop halfway through its answer, where do you start debugging?
In the first version of Anything API, the answer could be the agent process, a local model-routing shim, the worker reading its output, the event transport, or the browser. Several different failures looked like the same thing: a conversation that had stopped moving.
We launched Anything API in March. Running a coding agent inside a sandbox helped us ship quickly. As we added model options and longer-lived conversations, more of the application depended on that sandbox's lifecycle.
The sandbox got us to the first version
Anything API turns a task description into a callable API. Building it requires inspecting files, writing and executing code, and trying again. A coding agent already has much of that behavior.
We started with the Claude Agent SDK, a familiar option that gave us a practical way to build the first version. Running it inside a Vercel sandbox also put its commands and generated code in an isolated environment.
The integration grew around that decision. A worker launched the agent, read JSONL events from its standard output, and forwarded them toward the web app. A local routing shim handled model requests. The worker also participated in saving messages and managing workspace snapshots.
| Responsibility | V1 | V2 |
|---|---|---|
| Agent loop | Inside the sandbox | Application backend |
| Conversation streaming | Relayed from the sandbox | Application backend |
| Code execution | Sandbox | Sandbox |
The main change: move the agent loop and conversation stream into the application; keep code execution isolated.
A stalled stream could mean several different failures
The browser needed a coherent sequence of messages and tool updates. Underneath, one process emitted output that another had to interpret and relay.
How a reply reached the browser in v1. Read left to right: the amber sandbox produced and relayed events before they reached the application and web app. Model requests take a separate path through the shim inside the Vercel sandbox to OpenRouter outside it. Request setup is omitted.
How a reply reaches the browser in v2. The agent loop and stream now live in the green application backend. The agent calls OpenRouter directly, without a sandbox-local shim. The amber sandbox only executes tools and returns results. Reconnect and replay are omitted.
If the UI stopped receiving updates, we had to establish whether the agent was still working, whether its output was being parsed, and whether those events reached the client. A broken connection and a stalled agent could produce similar symptoms. Debugging meant tracing the same turn through several layers.
Model requests had their own translation layer. The coding agent brought assumptions about its model interface; our users wanted more choices. We routed requests through a shim, but every additional compatibility requirement made that boundary more work to maintain.
V1 did support models beyond Claude. The limitation was the integration cost: changing a model and changing the agent harness are different operations. Supporting another harness, such as Codex, would require accommodating its lifecycle and event format as well as its model calls.
Reopening a conversation meant restoring the agent
Returning to an old conversation exposed the same coupling in our snapshot design. V1 could reconnect to a live sandbox, create one from a thread-specific snapshot, or use a default snapshot. Separately, the worker compressed ~/.claude and uploaded the archive so we could restore the agent's session files.
We also had a detached timer process inside the sandbox. After a delay, it called an application endpoint to request a snapshot. We were coordinating the machine's lifecycle from a process running inside that machine, while maintaining another copy of the agent's state outside it.
The archive path had its own failure cases: compression could fail, an oversized archive could be skipped, and downloading or extracting the archive could fail during restoration. A successful sandbox creation did not establish that the agent session had been restored successfully.
What recovery could require in v1: restoring workspace files from a snapshot and the agent's session files from a separate archive. These are distinct restoration concerns, not steps required on every reconnect.
Retrying the download or snapshot restore could recover from a transient failure, but continuing the conversation still depended on restoring the agent's session files.
Moving the agent loop into the application
In v2, our backend drives the agent loop using the Vercel AI SDK's streamText. It loads conversation history, sends model requests, handles tool calls, persists messages, and produces the stream consumed by the web app. Commands and files live in a Daytona sandbox.
Redis supports reconnecting to a stream and replaying buffered events when configured.
For a stopped, archived, or paused Daytona sandbox, our resolver explicitly starts the existing instance before using it. A transient lookup failure is retried; it must not silently replace the thread's sandbox. A confirmed missing instance takes the replacement path.
We still use a base snapshot to provision new environments. Continuing a conversation now loads stored messages as model context, without restoring the Claude agent's home directory.
This gives us separate recovery paths for separate problems:
| What happened? | What needs to recover? |
|---|---|
| The browser disconnected during a turn | Reconnect to the stream and replay buffered events. |
| A user reopened an old conversation | Load its stored history as context for the next turn. |
| The execution sandbox stopped | Start it before executing more commands. |
| The execution sandbox is confirmed gone | Create a replacement and handle the missing workspace state. |
Conversation history does not reconstruct every file in a lost workspace. Likewise, stream replay does not make a running turn survive an application crash.
Provider integration now sits alongside the application-owned loop. We can change model adapters without routing requests through an agent process inside the sandbox. Supporting another complete agent harness would still require integration work; the AI SDK does not make every harness interchangeable.
Owning the loop means handling cancellation, timeouts, message ordering, context construction, and usage accounting. We must save replies before marking turns complete and prevent retries from charging twice or releasing a newer turn's lock.
The difference also shows up in our production error records. Here are two examples from Sentry, with identifiers omitted:
| V1: failed session resume | V2: timed-out turn | |
|---|---|---|
| Recorded error | resume_session_failed: no content emitted | turn-soft-timeout |
| Where the stack points | Dynamically evaluated code inside the sandbox event proxy | The backend start route, at the timeout-reporting source line |
| Diagnostic context | Thread and user identifiers, plus a session identifier in the error message | Thread and turn references, model, release, and timeout category |
The v1 record told us which session failed, but tracing it meant following code running inside the event proxy. The v2 record points to a backend source location and identifies the turn and model involved. These are different incidents, not a controlled before-and-after test: they illustrate the diagnostic context we have, not a measured reduction in failures or debugging time.
What the recovery benchmark showed
We tested the execution layer directly: create a sandbox, write a 5 MiB fixture and a unique canary, suspend it, then recover it and verify the file hash and canary. Returning an empty workspace would fail the test.
We ran 30 pairs on September 9, alternating which provider ran first. Vercel used the historical SDK's snapshot-and-restore path; Daytona used stop-and-start. All 60 recoveries passed verification.
Daytona returned a verified workspace in a median of 1.27 seconds, compared with 2.30 seconds for Vercel snapshot restoration: about a second sooner in this setup.
| Recovery time | Vercel snapshot restoration | Daytona restart |
|---|---|---|
| Median | 2.30 s | 1.27 s |
| p95 | 6.94 s | 1.68 s |
| Slowest | 19.69 s | 11.84 s |
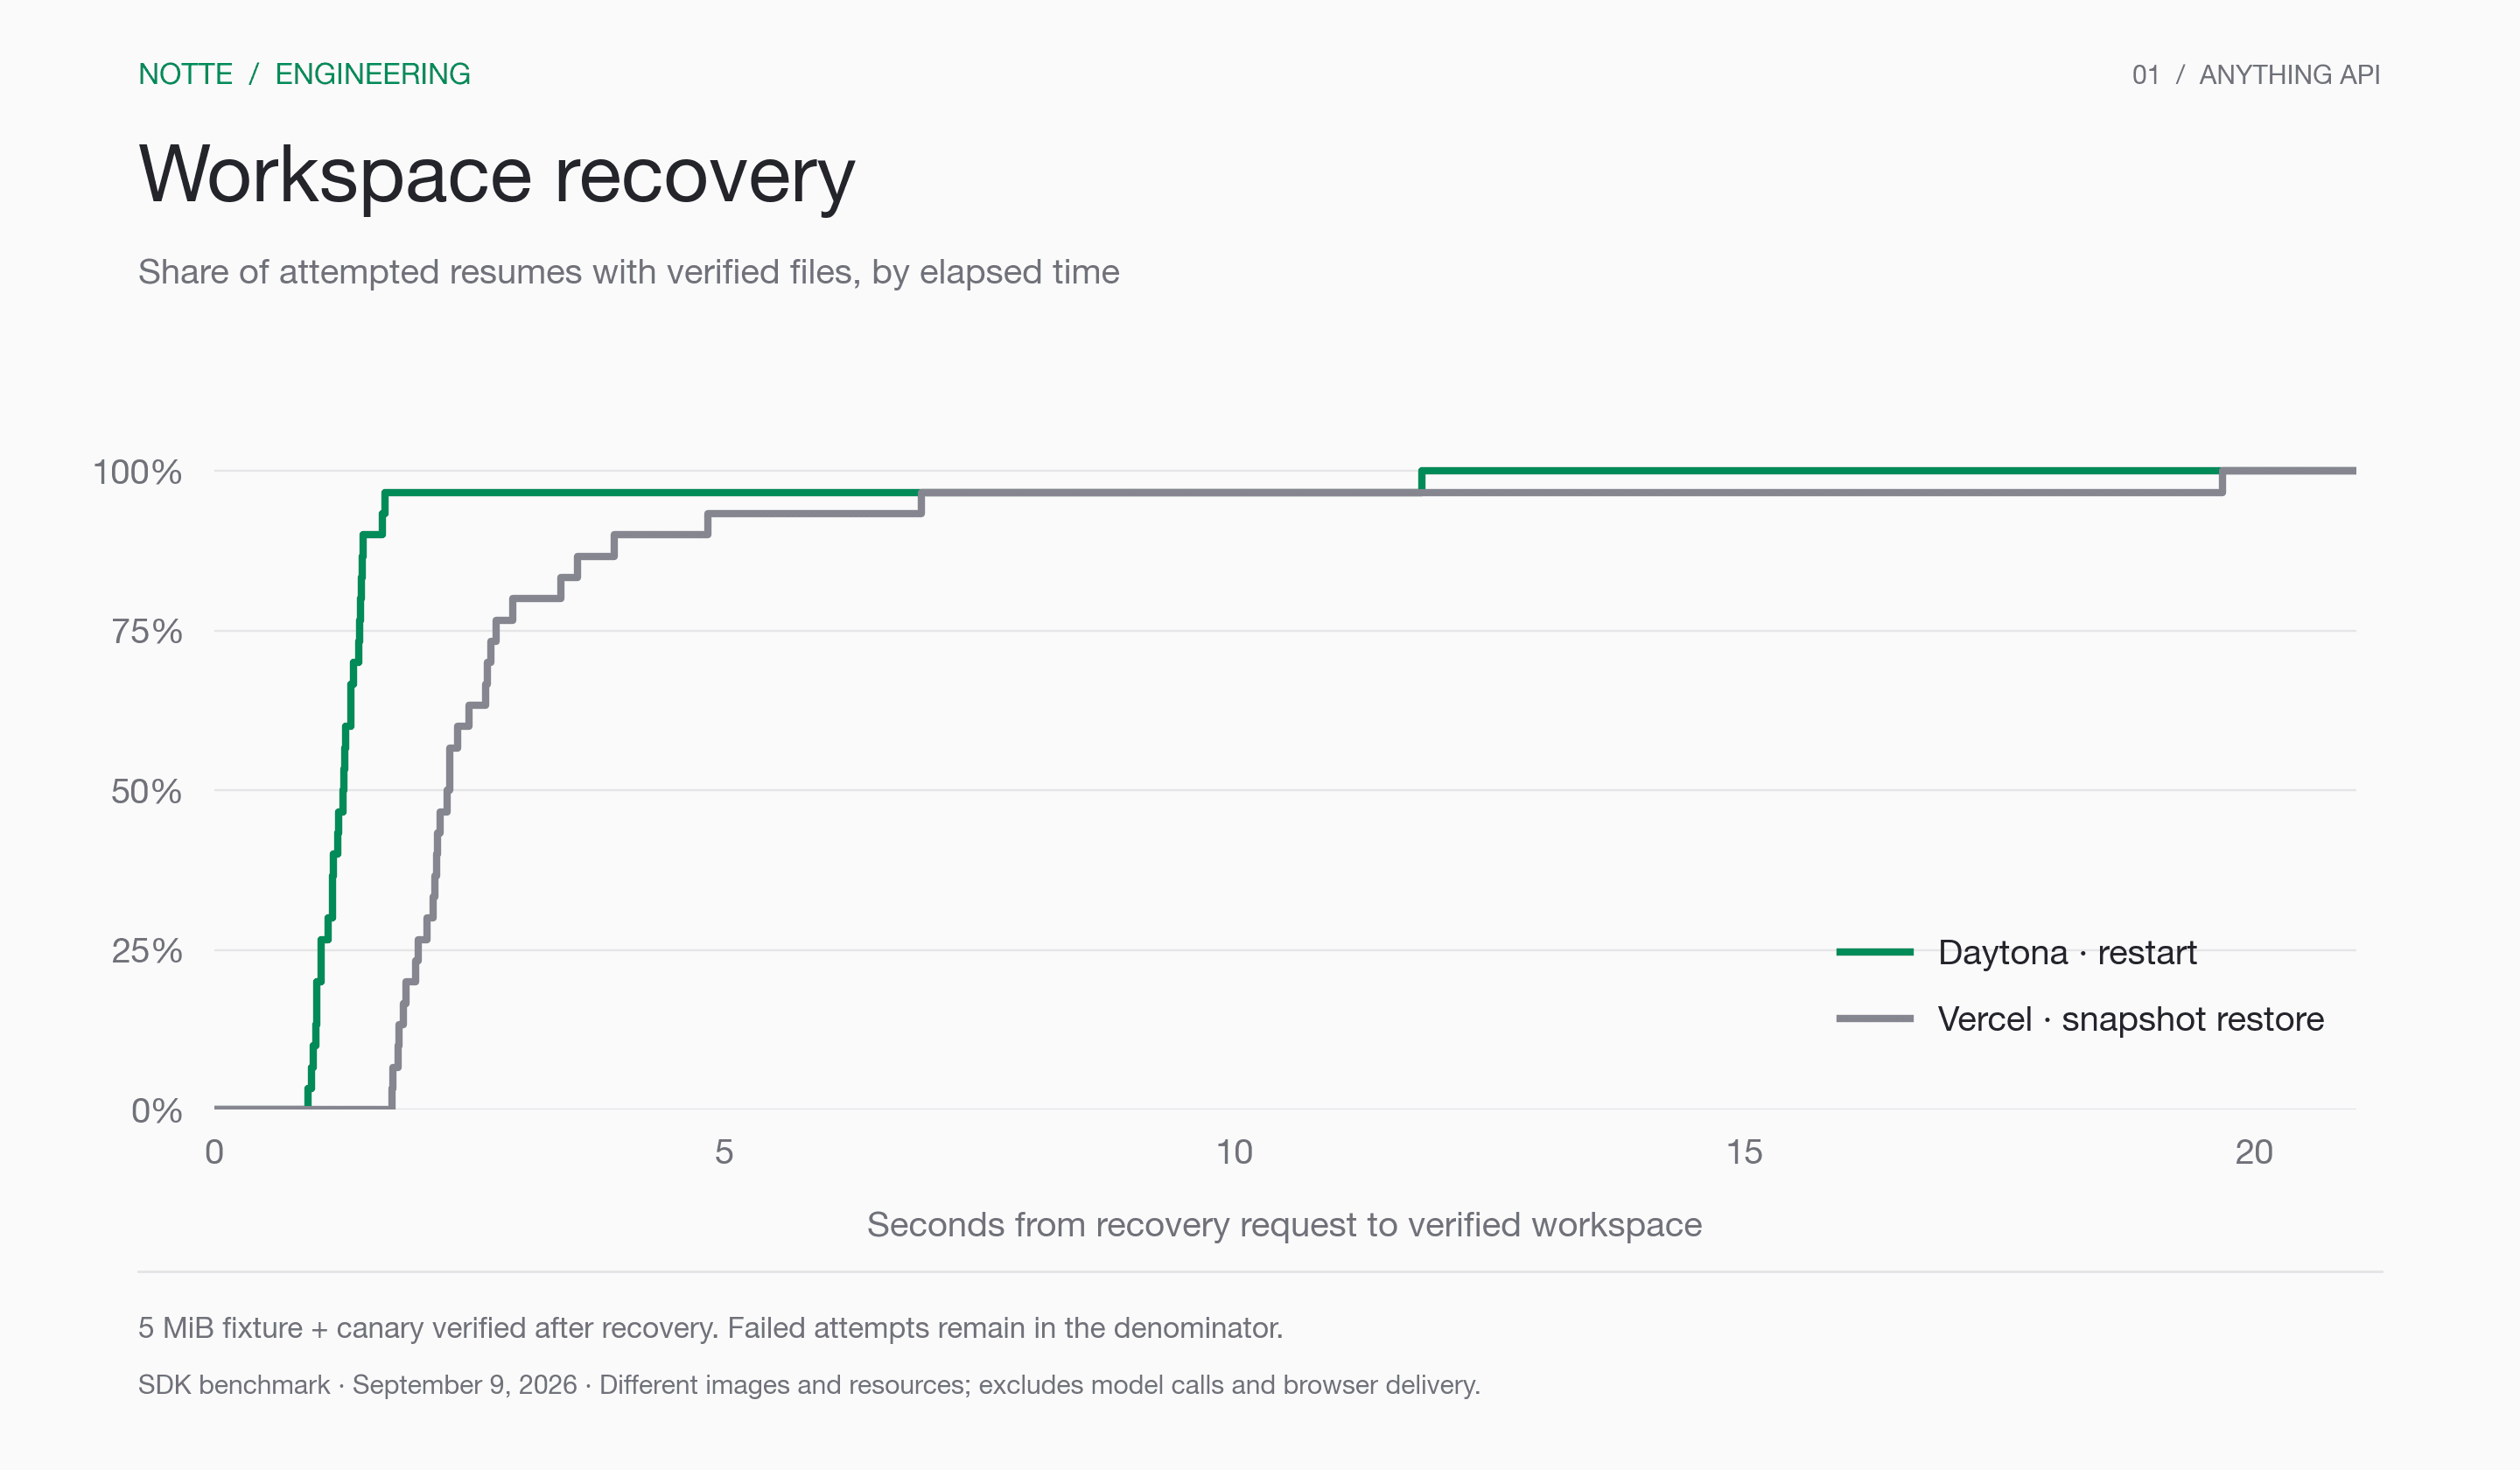
The horizontal axis is seconds since the SDK recovery request. The vertical axis is the percentage of attempted resumes that have verified their files by that time. Snapshot creation or stopping has already finished before this timer begins.
The flat sections near the top show the last few workspaces still waiting. Both paths had slow outliers.
We also measured provisioning, lookup, and suspension:
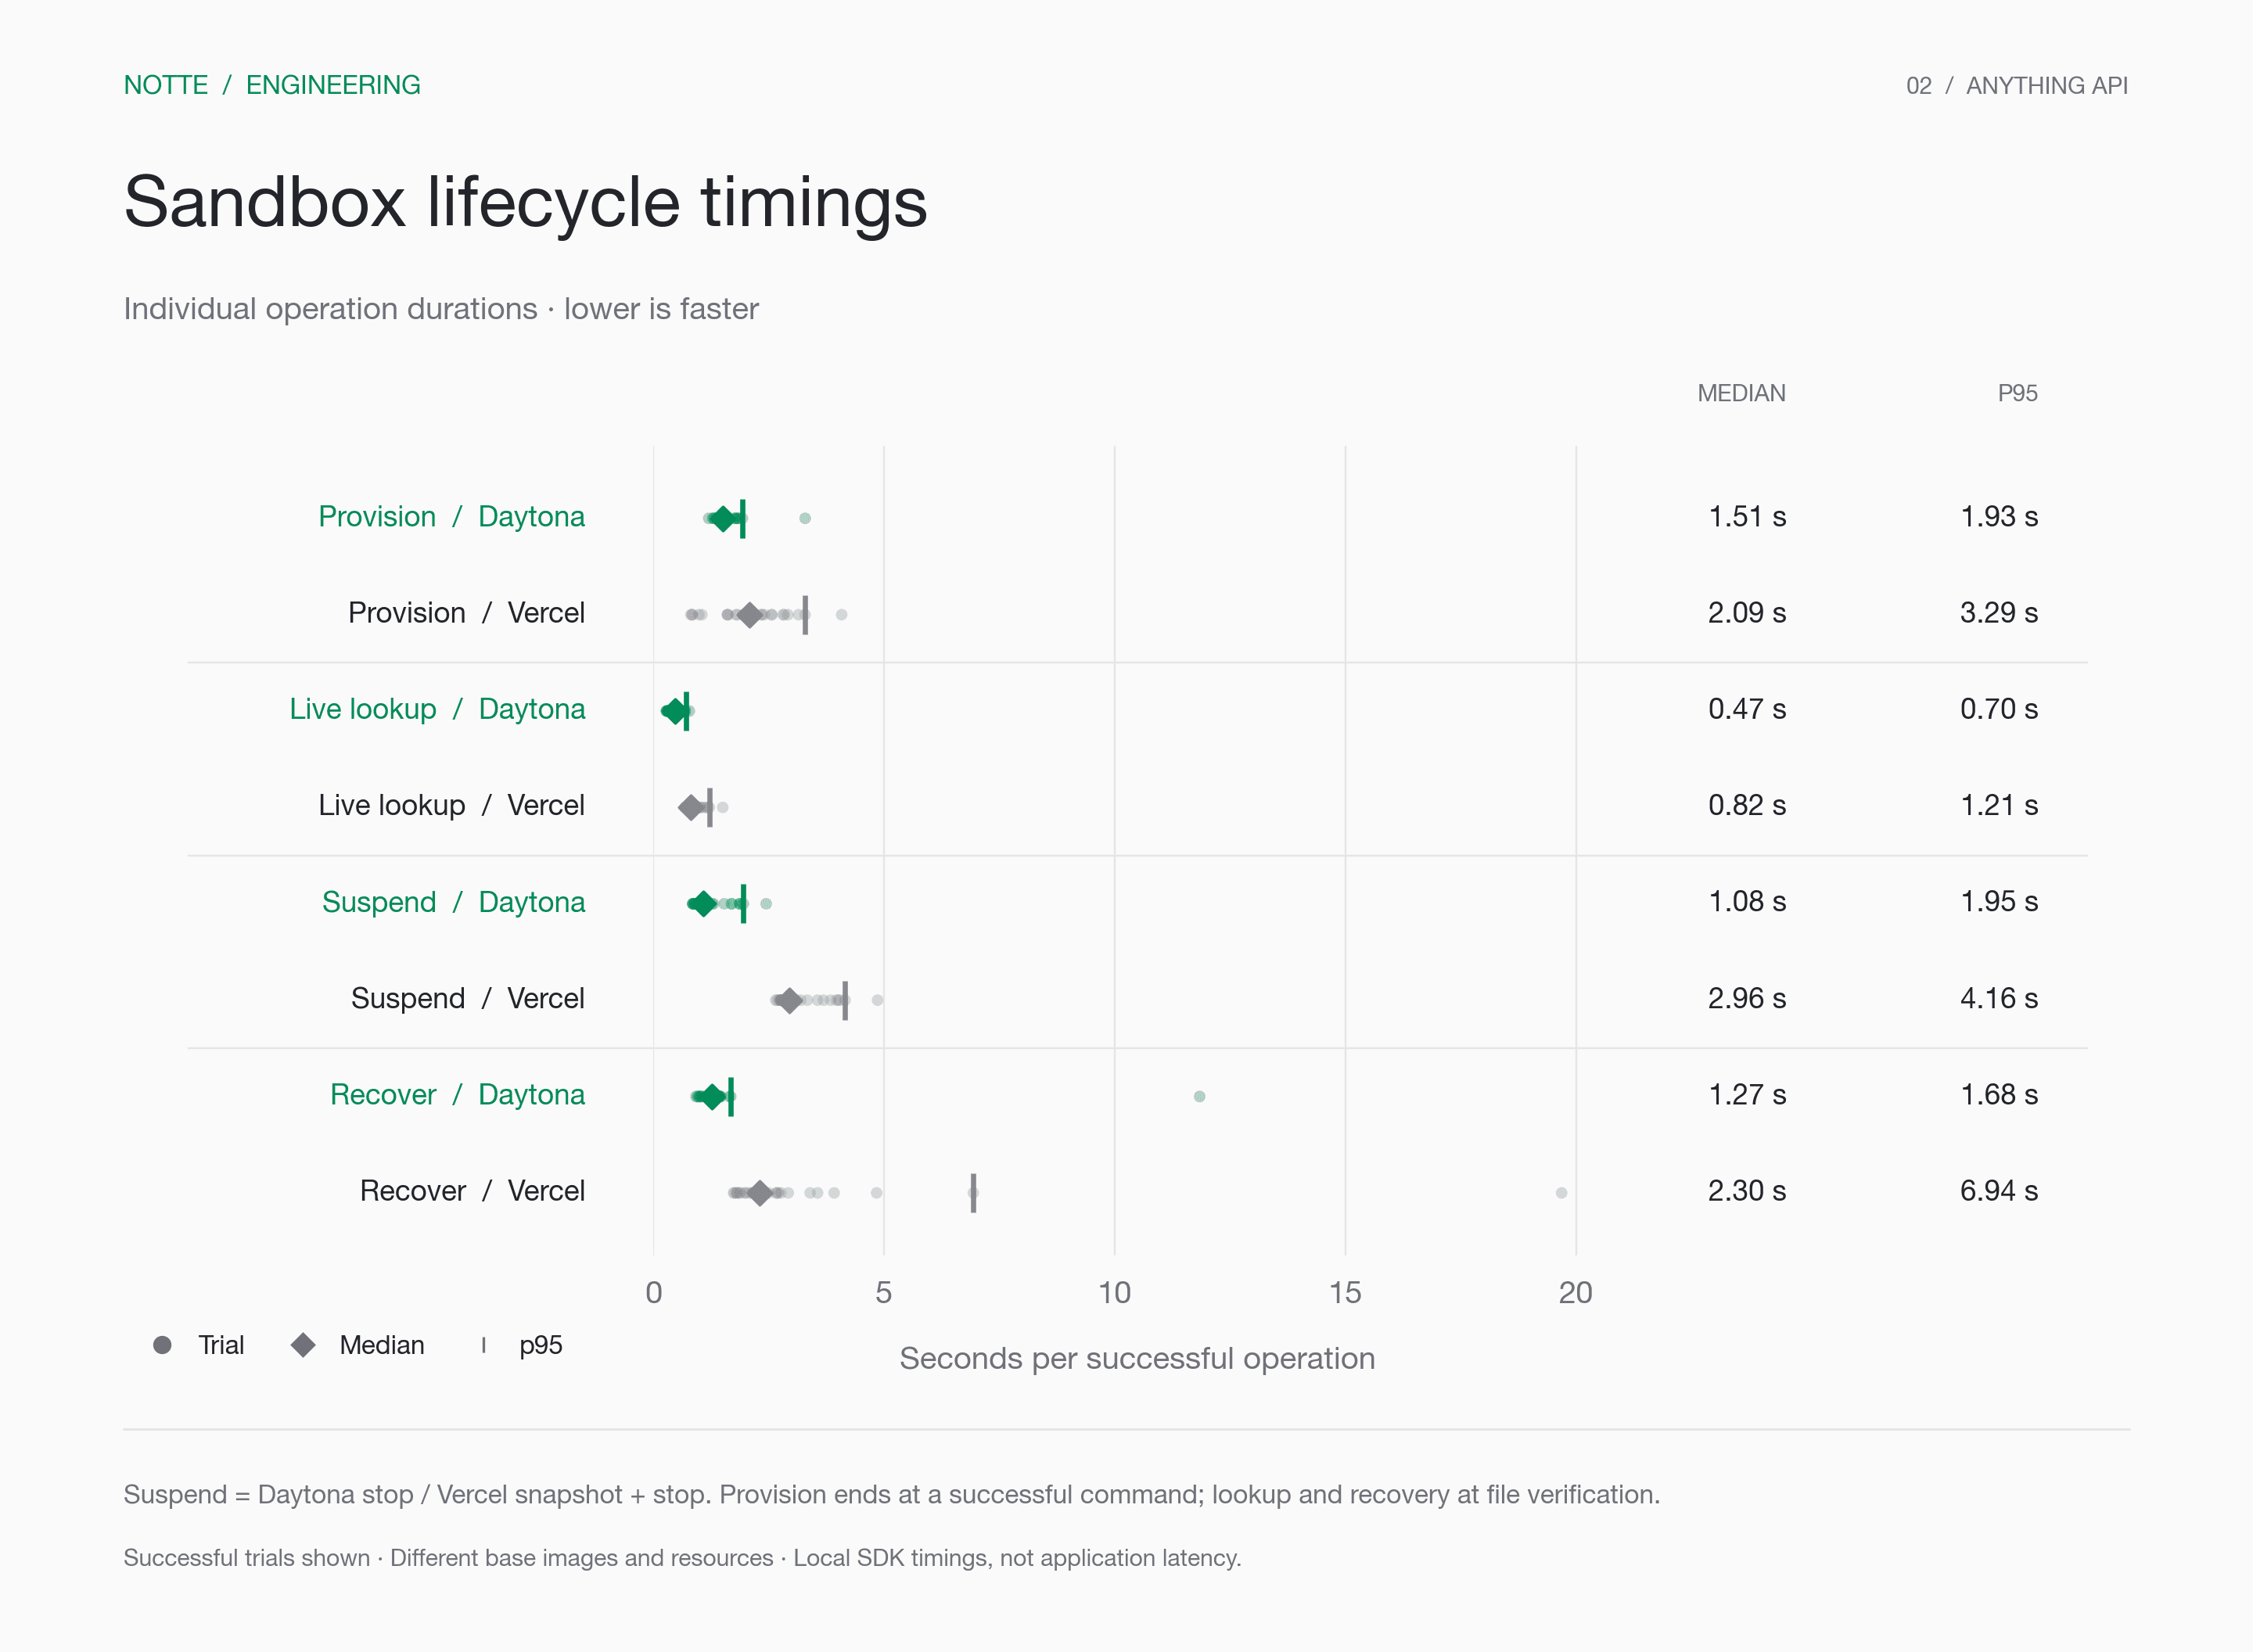
Each row names an operation; horizontal position shows its duration in seconds. Dots are individual successful trials, diamonds are medians, and vertical ticks mark p95. Vercel's snapshot-and-stop and Daytona's stop are different preparation operations.
Timing ends at file verification, before Claude session restoration, model context, or browser delivery. The deleted v1 production image meant using a surviving Vercel branch image with 2 CPUs and 4 GiB; Daytona used our 1 CPU, 1 GiB fallback. Regions and warm-pool state were not matched, and the fixture compresses well. With 30 observations per path, p95 is the 29th result. These are preliminary measurements of different recovery paths, not an isolated provider effect or an end-to-end speedup. A separate pilot hit a 90-second Daytona provisioning timeout.
Next, we want representative workspaces after realistic idle periods, then send-to-first-visible-response measurements with the same model.
Production browser telemetry
PostHog provides a separate view of recorded exceptions across tracked sessions. We excluded React hydration mismatches consistently across every month because they do not measure the sandbox refactor.
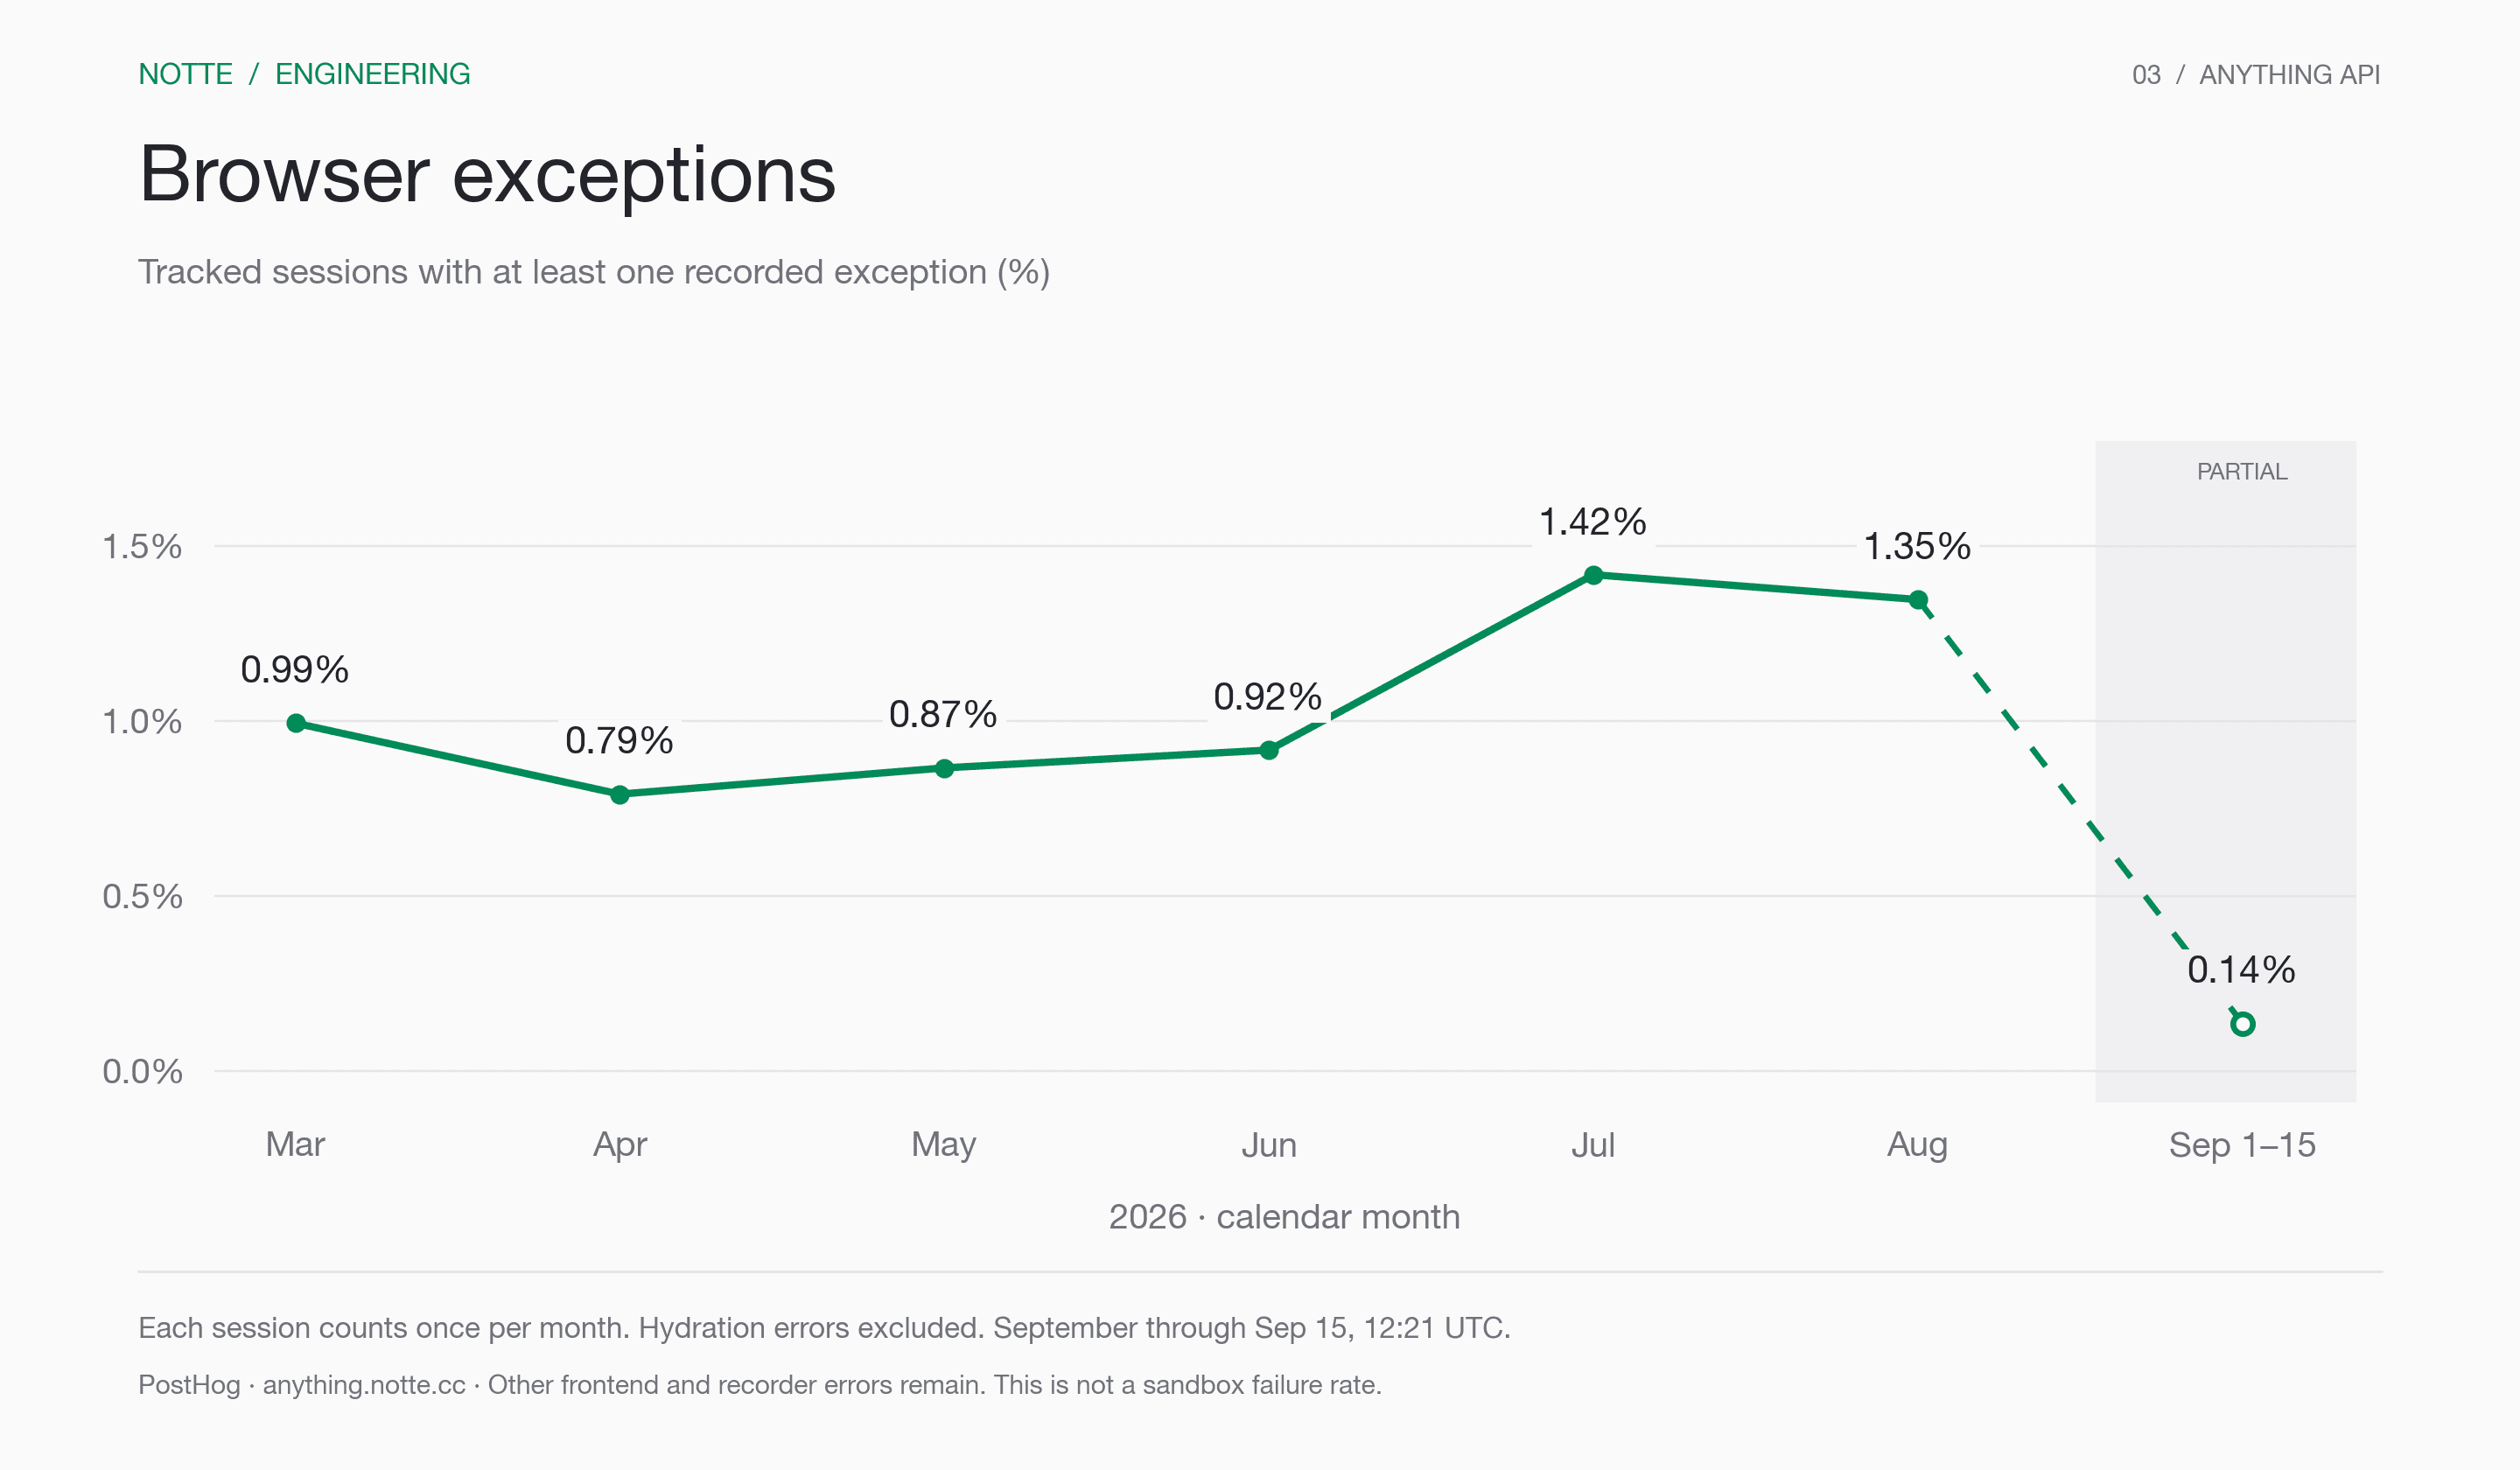
The vertical axis is the percentage of tracked sessions with at least one qualifying exception; repeated reports count once per session per month. September covers September 1-15, through 12:21 UTC on September 15. The session denominator is unchanged by the exclusion.
The rate was 1.35% in August and 0.14% in September's observed window. Other frontend and recorder errors remain included, so this is production context, not evidence that sandbox failures disappeared or that v2 caused the change.
In hindsight, we gave the sandbox too many jobs. It ran the code, hosted the agent, and produced the stream. When a turn stalled, we had to work out whether the problem was in the agent, the worker, the proxy, or the sandbox itself. In v2, the agent loop and streaming run in our backend, while the sandbox handles code execution. We still have failures to debug, but we can inspect the agent and its stream without first recovering the environment running the code.
Further reading
- Anything API best practices: writing task descriptions and testing generated functions.
- AI SDK streaming: the API behind our application-owned agent loop.
- Daytona sandbox lifecycle: starting, stopping, and recovering execution environments.
- Our benchmark methodology and results: the setup, measurements, and limits behind the recovery graphs.